The Importance of Valve Cover Gaskets

One of the first deferred maintenance items on the Focus was the valve cover gasket. Although the previous owner had power-washed the engine bay before I purchased it (a big red flag), the oil pan and underside of the engine was covered in oil and road grime. I looked for noticable leaks, but nothing was obviously leaking while the engine was running. After sitting overnight, I noticed weeping from the drivers side valve cover, and figured it might be possible the valve cover was the culprit.

The valve cover, as seen from the passenger side. Note the oil residue around the coils.

The valve cover, as seen from the passenger side. Note the oil residue around the coils.

When removing the coils, I noticed the rubber surrounds and the area around them on the valve cover were quite oily, and after removing the valve covers, I saw why: the entire coil chamber was filled to the absolute brim with oil. The coils had been sitting in a few inches of oil for quite some time, and this made it even more likely the gasket was done, as the coil chambers are surrounded by small gaskets of their own.

Coil pack chambers filled with oil. The coils sit inside of the rectangular shaped sections in between the overhead cams. One on each end, and two in the center.

Coil pack chambers filled with oil. The coils sit inside of the rectangular shaped sections in between the overhead cams. One on each end, and two in the center.

After using a turkey baster to remove as much oil as possible, the spark plugs were replaced along with the valve cover gasket which was completely brittle and flattened. Although a lot of the oil was removed from that cavity, there was some still left, which inevitably went into the cylinder when changing out the spark plugs. This led to a fantastic cloud of smoke on startup, and it took about ten minutes to burn off all that oil. I was able to capture a short video about two or three minutes after the initial smoke plume.

Changing the valve cover gasket, oil, and spark plugs, proved to smooth out the idle and stop the oil leaks. These maintenance items also help to ensure this engine will last the difficult conditions of an endurance race.

24 Hours of Lemons

This is the inaugural post documenting my 24 Hours of Lemons build. For those that are unfamiliar, the 24 Hours of Lemons is an endurance race where the car budget, excluding safety items, cannot exceed $500. Generally speaking, $500 cars are terrible cars. To make matters more, ahem, interesting, customization is encouraged and rewarded. The video below highlights one extreme example, a Porsche 911 powered by a diesel tractor engine.

While I appreciate the ingenuity and audacity of that Porsche build, the car I am building is a relatively stock 2005 Ford Focus in Sangria Red. When new, it made 136 HP and 133 lb-ft torque, with a 5 speed manual transmission. As it sits, it has 265,000 miles, is missing the passenger window, has a leaking tire, a horrible vibration emanating from the engine bay at any RPM that has cracked the windshield, and a decent oil leak. It also likely needs about 100,000 miles of deferred maintenance.

Side profile.jpg

What this particular car has going for it is a relatively reliable platform, great handling, a racing pedigree (see here and here), and a lot of aftermarket support. The rough outline of the plan:

  • Complete deferred maintenance

  • Install safety equipment

  • Complete race prep

  • Install performance items that fit within budget

In the coming weeks I will do my best to document the work required for turning this car from a decent economy car into a Lemons contender.

Optimal Sizing and Operation of a Microgrid with Electric Vehicle Charging

This was a group project for one of the best classes I have ever taken, not only at Berkeley, but in my entire career as a student. This class is taught by Professor Scott Moura, and is titled Energy Systems and Control. The goal of this project was to correctly size and operate a small microgrid, such as would be found in a commercial or industrial facility, along with determining the ideal number of chargers for the parking structure.

A quote from the final report:

Since Electric vehicles (EVs) are increasing in popularity and access to charging infrastructure will play an important role in their widespread adoption, additional investment in existing commercial facilities will be required and pairing vehicle charging infrastructure with microgrids (MGs) may help to mitigate energy consumption requirements from EVs. This project developed a model for the economic optimization of a grid-connected commercial MG that includes renewable energy generation, on-site energy storage, and EV charging with Level 2 and Level 3 capabilities. A robust optimization method that considers the stochastic nature of energy demanded and supplied was developed while satisfying constraints imposed by the facility. Results from a Mixed-Integer Linear Program (MILP) and Mixed-Integer Second-Order Cone Program (MISOCP) were evaluated to determine primary drivers for infrastructure sizing and to evaluate the robustness of the optimization model for various uncertainty levels of input data. The MISOCP was able to identify infeasible scenarios and was able to plan the optimal scenario while being robust to all stochastic variables, making it the preferred choice for planning purposes over the MILP.

Translation: this problem requires us to minimize capital cost of the system, energy cost from importing energy from the grid, demand charges, with the ability to consider export revenue, while attempting to determine the number of Level 2 and a Level 3 chargers required. This is a hard problem because mixed-integer second order cone problems (MISOCP) require a discrete integer value and are non-convex, additional integer values require an exponential increase in the number of combinations to solve the problem (even when some combinations are infeasible), and off-the-shelf programs such as CVX software cannot reach a solution.

* A quick side note: the graphs and images were made with Excel and PowerPoint… so please excuse their simplicity.

objective function

The objective function is subject to linear constraints such as storage system dynamics and non-linear SOCP constraints such as renewable system dynamics, EV energy dynamics, and grid import/export limitations. While expanded constraints are not included here, there are about 40 different equations for all the constraint categories. The SOCP constraints include the reliability of grid import/export dynamics (which rely on stochastic load and renewable energy generation), and the stochastic demand of EV charging. The first step was to consider methods to reduce the complexity of this model so that it could be easily solved without paying high computational or temporal penalties.

Our objective function: minimize capital cost, energy cost, demand charge, while subtracting revenue.

Our objective function: minimize capital cost, energy cost, demand charge, while subtracting revenue.

Reducing complexity

The first step was to reduce complexity from the original MISOCP. Several variables in the objective function are affected by this change, including x, and the number of chargers, n. This reduction in complexity required an assumption about the number of chargers: for a 30 unit complex, a building manager might be interested in installing a combination of up to 4 each of level 2 and level 3 charging spaces (or roughly 25 percent of parking if each unit has one spot). The difficulty lies in determining how many of each charger should be installed to allow for a high level of service for the residents while minimizing cost. To reduce complexity from a MISOCP to SOCP, combinations of level 2 and level 3 chargers were evaluated over many iterations to find the optimal solution.

Results

After many iterations, the optimal solution was 3 level 2 chargers and 1 level 3 charger. Other feasible solutions found with the iterative method were higher cost or infeasible. Inside the red circle at the bottom of the graph are the sets of infeasible solutions, which means that those solutions were not able to satisfy all of the constraints within those scenarios, for example, the number of chargers were not able to meet the EV demand at some time step. After the optimal number of chargers was determined, the values were implemented into the data sets to determine the robustness of the solution.

The optimal number of EV chargers minimized cost while meeting the greatest demand at any given time step.

The optimal number of EV chargers minimized cost while meeting the greatest demand at any given time step.

modeling and corner cases

The first challenge that arose was an interesting corner case that resulted in battery charging and discharging at the same time. This occurred when energy demand was quite small compared to solar generation, and grid export had reached the maximum limit. When faced with over generation, the model attempted to expend that excess energy through the battery’s internal resistance. As you can imagine, this has a severe negative impact on battery life. This error was traced to a simple error in the data set, but it helped to show how important it is for the model to be reviewed closely and critically for any irregularities.

boundary condition: battery sizing

The difference in required battery size is the blue arrow between the red and blue horizontal lines from time step 14 to 20.

The difference in required battery size is the blue arrow between the red and blue horizontal lines from time step 14 to 20.

The next challenge was to consider the model’s feasibility through all time steps. With a finite time horizon, the model would attempt to maximize profit (and therefore minimize cost) when it could. The result was two boundary conditions: the first of which is that the battery completely discharged for grid export at the final step regardless of the battery state after the time horizon. This resulted in additional batteries being purchased (which increase cost) simply to satisfy the final time step.

The solution to the final state problem was to impose a minimum battery SOC at the final step. For this model it means that the energy level in the battery at the final time step must be greater than 10% of the maximum energy level of the battery multiplied by the number of battery modules required to meet peak demand. As you can see from the figure, while the model previously had battery energy at higher levels, and therefore higher cost, the constrained battery size still satisfies demand while reducing cost.

boundary condition: EV Charging demand

The mean demand is the blue line below, and the 99th percentile of demand is the yellow line above. The model relied on the 99th percentile of EV demand to maximize profitability.

The mean demand is the blue line below, and the 99th percentile of demand is the yellow line above. The model relied on the 99th percentile of EV demand to maximize profitability.

The second boundary condition: high levels of EV charging regardless of EV demand. To satisfy EV demand without selling more energy than demanded, a limit on the uncertainty in the upper bound of demand needs to be set.

With the existing chance constraints, the model attempted to sell as much EV charging as possible, at the 99th percentile of EV charging demand, to maximize revenue because of the high profitability in that slim feasible region, so a constraint was implemented to limit the uncertainty. In other words, the model is able to satisfy EV charging for residents 95% of the time, but not overestimate the potential revenue from EV charging as a whole which allows the model to remain robust, while satisfying demand, without being overly optimistic about potential revenue.

conclusion

To conclude: in this project, an optimization model was developed for installing EV chargers while identifying possible drawbacks. The cost of the project was minimized by the objective function by iterating over several SOCPs, maintaining the stochastic elements of the original model, and corner cases were addressed along with boundary conditions to ensure the model is robust to EV charging, renewable generation, and building load.

This was a really fun project with a great group that really helped me learn a lot about optimization generally and how to think about and solve complex control and modeling problems. It was also helpful to have this experience within a group dynamic where everyone brought something different to the table. Everyone that I worked with has moved onto successful careers or advanced degrees, and I hope they find these experiences as helpful as I did!

Undergraduate Research: Ammonia + Ice

My first long-term research project (and undergraduate thesis!) was determining if there was any difference between the structure of ice that contained ammonia and pure water ice. This research was inspired by icy satellites throughout the solar system such as Charon and Enceladus that have been found to contain ammonia and ice. Typically, ice forms a thick crustal layer on icy satellites that contain compounds such as ammonia. Icy crustal formations on planetary satellites are affected by a variety of stresses, including tidal pull from neighboring planets and other satellites and vertical temperature differentials from deep within the crust to the surface.

The material below is all from my undergraduate thesis, with significant edits to condense the material and for ease of reading. I really enjoyed this research topic, even if it meant I spent most of my time in a very cold freezer!

why ammonia + ice?

In my research, I was trying to determine the dihedral angle of ammonia + ice. The plus sign here is intentional, as the system contains both, with no real mixing like if they were both liquid. First, on why this is important:

The dihedral angle in this type of ice will be used to infer rheological characteristics and eventually will help predict crustal behavior on icy satellites. The rheology of a material is the behavior it displays when placed under stress, and in partially molten systems like icy crusts, rheological characteristics are determined by the equilibrium microstructure between the solid and melt, defined as the dihedral angle (this is a pretty good primer on ice rheology). Dihedral angles of crystalline solids determine a variety of physical characteristics for the material and the rheological characteristics of ice are closely related to this microstructure.

Of additional interest is that having a large wetted area at the intersection between ice crystals may provide a path for materials from the inside of the icy crust to get to the surface, which could mean that surface samples (from something like the Curiosity rover) can indicate what is happening beneath the surface!

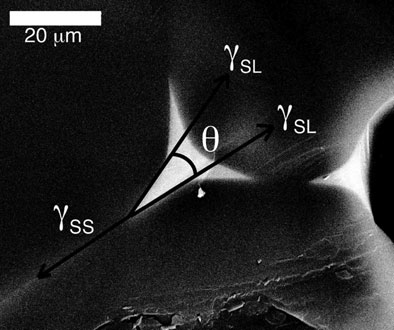
The dihedral angle between these ice crystals is marked here as theta.

The dihedral angle between these ice crystals is marked here as theta.

what is the dihedral angle?

The dihedral angle is the angle of the solid-liquid interface towards the opposite solid solid interfaces with a vertex at the solid-solid interface, indicated by theta in the picture on the right. Since the freezing temperature of water is higher than that of ammonia, pockets of ammonia liquid solution with increasing concentration are squeezed out of the water ice crystalline solid as it freezes, when the temperature decreases. Due to the increase in ammonia concentration in the remaining liquid as the pure water crystals freeze, the liquid needs to be significantly colder to freeze than pure water. This phenomena follows the liquidus curve in the eutectic phase diagram, which gives an idea of how concentrated the ammonia will be at a particular temperature.

On an icy satellite, this means that the icy crust will have little pockets of liquid ammonia between the ice crystals, which affects how the ice behaves when, for example, a planet or other satellite causes a tidal pull on a sub-surface ocean.

how were samples made?

Samples were made by mixing bulk ice (which was painstakingly made in advance to be pure) and an ammonia solution and freezing at -17 ˚C (equivalent to 1 ˚F) . Samples were held at that temperature for up to three weeks to allow them to reach equilibrium structure at that temperature and then quenched in liquid nitrogen (-196 ˚C / -321 ˚F) to completely freeze in the ice + liquid structure. Samples were then prepared for observation, which meant quickly getting them shaved down to eliminate any odd surface structures and under a microscope to be photographed. Later, the dihedral angle was measured using software that could measure angles on the images. Over the course of a few months, hundreds of pictures led to thousands of measurements!

pictures!

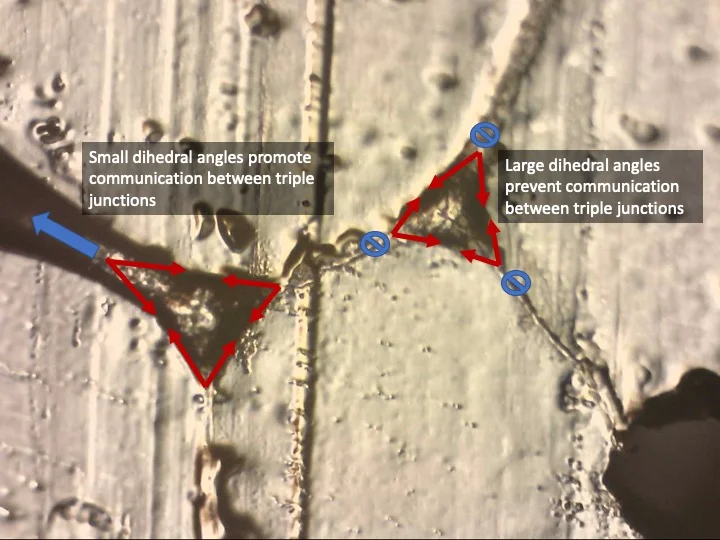
Dihedral angle size and communication between ice crystal junctions. The line down the center of the ice crystals is from the blade used to shave the sample.

Dihedral angle size and communication between ice crystal junctions. The line down the center of the ice crystals is from the blade used to shave the sample.

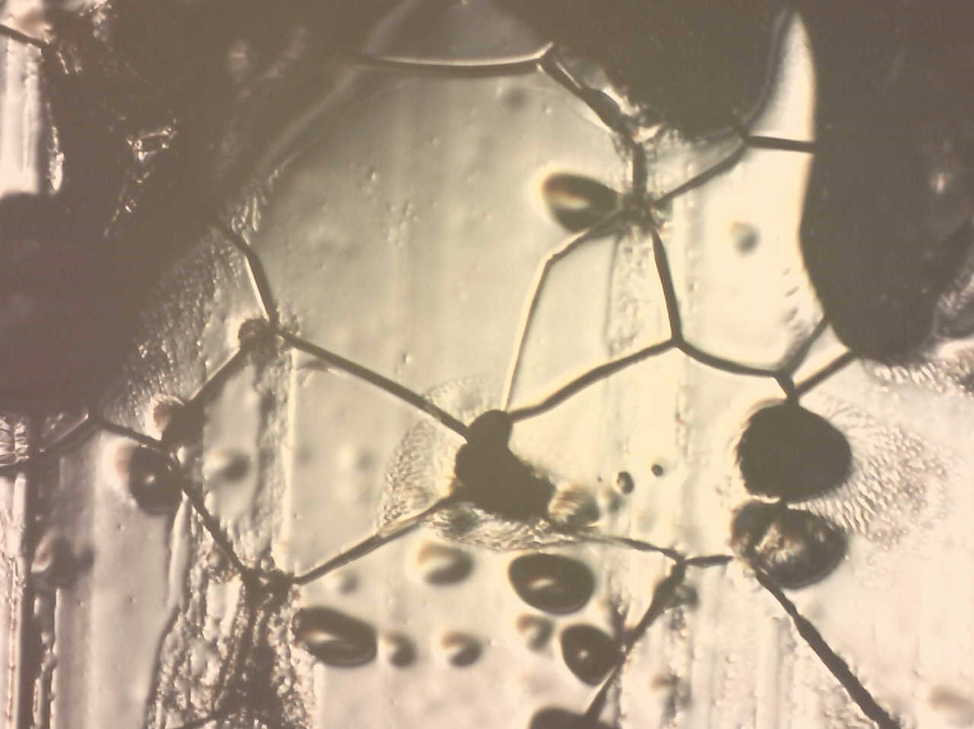
Two sets of crystal intersections. In the lower middle-left of the figure, a dry intersection is observed. In the upper middle, a wetted intersection is observed.

Two sets of crystal intersections. In the lower middle-left of the figure, a dry intersection is observed. In the upper middle, a wetted intersection is observed.

A field of ice crystals with a lot of different triple intersections.

A field of ice crystals with a lot of different triple intersections.